
Reporting isn’t about pretty charts. It’s about getting answers fast and making decisions before small problems turn into bigger ones. That’s why companies using Microsoft Fabric and Power BI are ahead of the curve.
From finance or supply chain, better data means better calls. When reports are fast, clear, and connected, teams waste less time and money. These tools bring it all together, with flexibility that fits real business needs.
How Power BI Can Be Used in Supply Chain Management
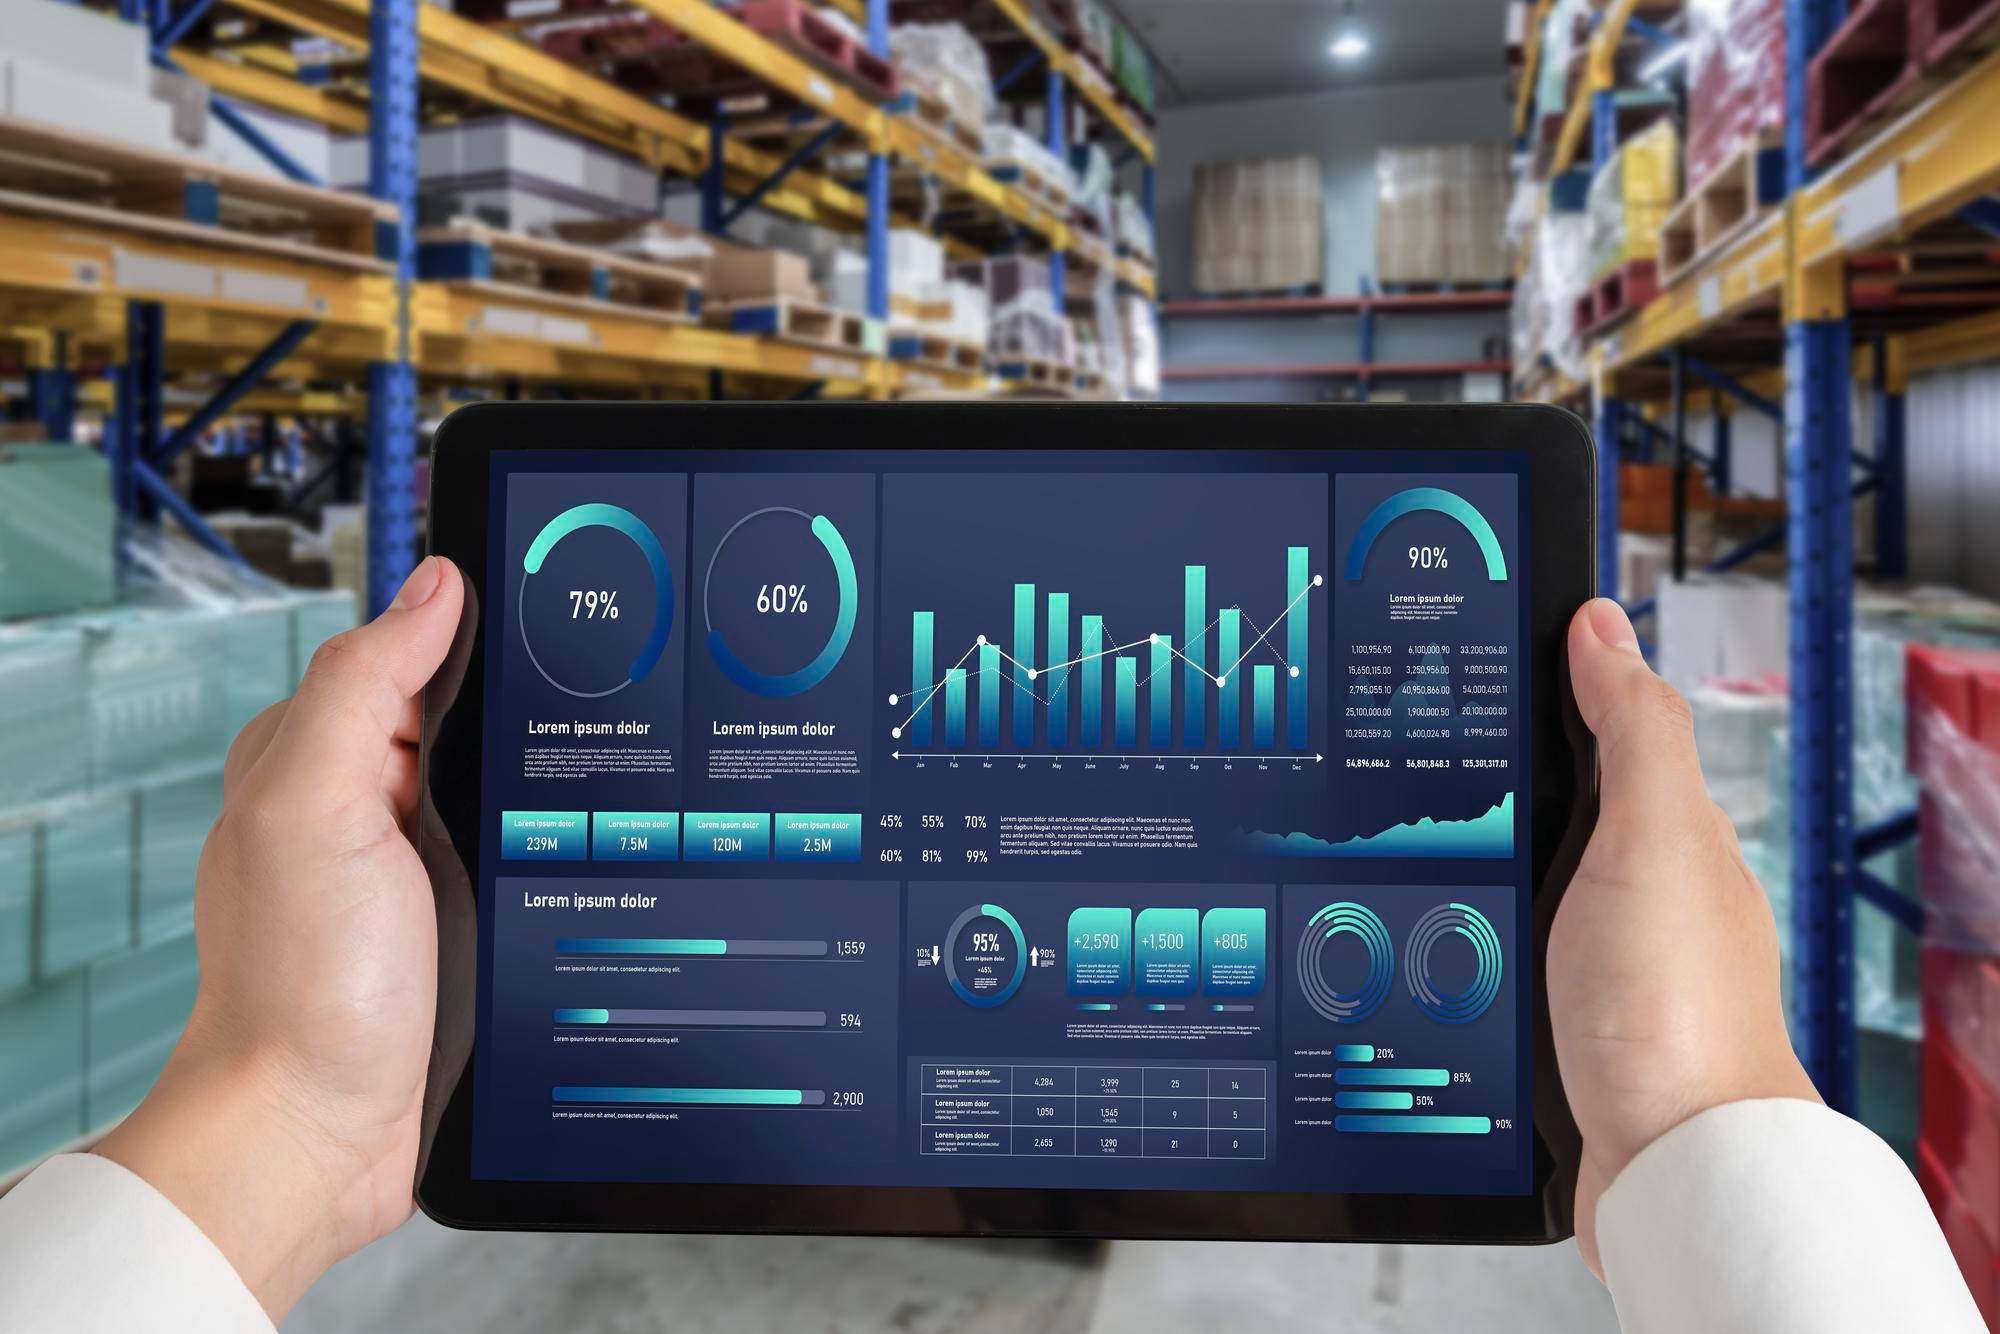
Power BI and Microsoft Fabric make it easier to build reports that show what’s happening, when it’s happening. From warehouse floors to finance desks, Power BI usage helps teams get the story behind the numbers. Here’s where it makes the biggest difference.
Collecting and Processing Data
Data is scattered across ERP, Excel sheets, emails, and apps. Power BI brings it all in, cleans it up, and turns it into readable dashboards. This means fewer delays and fewer hours wasted on manual updates.
Accessing Real-Time Data
Reports don’t help if they’re old. With Fabric and Power BI, teams access near real-time insights. Shipments, stock levels, payments, or delays, they can see what’s happening and act without waiting for end-of-day reports.
Customizing Reports and Visualizations
Different teams need different views. Some want graphs while others want lists. Either way, Power BI gives the flexibility to set up dashboards that suit everyone. With the supply chain dashboard, users build what works for their exact needs.
Gaining Actionable Insights
Data doesn’t speak for itself. Those daunting numbers and figures can be hard to understand. Power BI does the heavy lifting by finding trends and spotting gaps. It also highlights red flags. These are more than just numbers. They’re signals that ensure you understand the proper and make the right decisions. With the right setup, Power BI can point teams toward what needs attention.
Tracking KPIs
Missed a delivery window? Overspent on freight? Inventory costs too high? Power BI tracks all of it. KPIs sit front and center so teams don’t miss targets. That’s what makes business intelligence in the supply chain so effective. Measuring the effectiveness of KPIS is equally important as setting them up. That is something that Power BI can help you with.
Visualizing Data from Multiple and Different Data Sources
Finance uses one system while operations use another. Amidst this, you find that suppliers send Excel files. With so much data coming from different sides, it might be difficult for you to assess it properly. Power BI stitches these together into one clean view. That’s real supply chain data visualization as all your numbers are in one place with no mess.
Use Cases of Power BI in Supply Chain Management
Supply chains can get messy as orders get lost or vendors miss deadlines. The last problem you want is warehouses running out of space. Nevertheless, reports can’t solve what they can’t see. Power BI use cases in supply chain show how better visibility leads to fewer surprises and faster fixes.
· Warehouse staff track in-and-out flows daily.
· Finance teams compare planned vs actual shipping costs
· Planners see delays early and reschedule quickly
· Procurement teams monitor lead times and fill rates
· Leaders review the Power BI supply chain dashboard before every meeting
Using Analytics to Optimize Key Areas in the Warehouse
Inside a warehouse, small problems pile up fast. A slow picker or a missing pallet can drain money and time. With business intelligence for supply chain, teams get a better eye on these details before they become bottlenecks. Let’s go over the ways through which you can optimize key parts of your warehouse through analytics.
Tracking Movement in Logistics
Power BI tracks every touchpoint. When goods are received, when they’re moved, when they’re shipped. This lets logistics teams reduce wait times and avoid traffic jams, on foot or wheel.
Monitoring Sales or Orders
Power BI shows sales trends in real time. In case of a demand spike or a certain SKU stuck, it will provide you with a clear picture of it. Teams can restock, promote, or phase out based on what’s moving and what’s not.
Checking Vendor Compliance
Sometimes, vendors might miss delivery windows. Or they might be short on promised quantity. Reports catch all such issues with vendors. Business intelligence supply chain dashboards hold vendors accountable with numbers they can’t argue with.
Planning and Scheduling Production
There is no need to over-produce or over-stock the wrong item. Power BI helps planners align production runs with actual demand. It shows what’s needed and when. As a result, it ensures that there is no pileup of inventory.
Managing Inventories
Power BI flags the problem areas. It can tell you if you are sitting on dead stock or if your reorder points are too high. Supply chain business intelligence tools, such as Power BI keeps warehouses lean without running empty.
Measuring Quality Assurance
Returns, rejects, rework, etc., all cost money. Power BI tracks quality KPIs. If defects go up, teams know where to dig and fix the issue. That’s how Power BI supply chain tools help protect the bottom line.
Final Thoughts
Power BI and Fabric don’t do the work for you, but they show you where it needs to be done. That’s how reporting goes from passive to powerful. If you want Help Getting the Most from Your Reporting, then CubePeaks is here to help you out.
Our team helps finance and supply chain teams turn messy data into clear decisions. If you’re building a supply chain tableau dashboard, automating reports, or just trying to make sense of it all, then CubePeaks can help. Let’s make your data work for you.